4 April 2017
Australia has experienced a sequence of severe fire seasons in recent years, leading to the loss of many properties and lives. The seasons have stretched fire services and communities. Understanding if things are changing, and how future risks may need to be managed is of critical important to minimise future losses.
The Bureau of Meteorology’s fire weather warnings are an important tool for helping fire agencies prepare for potential bushfire conditions. The warnings are based on a fire danger index (FFDI) that considers temperature, rainfall, humidity and wind.
New work from Hub researchers allows these warnings to be placed in a historical context, with the production of a 67-year fire weather climatology. This dataset consists of daily FFDI values extending back to 1950, allowing us to look back on different time periods to see what the fire weather was. The value of this climatology is not so much about what happened on a particular day in history, however, as much as providing a big picture with regards to fire weather in our changing climate.
Informing operational decisions
But how does knowing about fire weather over the past 70 years or so help fire agencies today?
“It’s about providing guidance on how extreme the current conditions are,” explains Andrew Dowdy, who leads the Hub’s Extreme weather projections project. “Information from this dataset is one of the factors that fire agencies can consider in their decision making.”
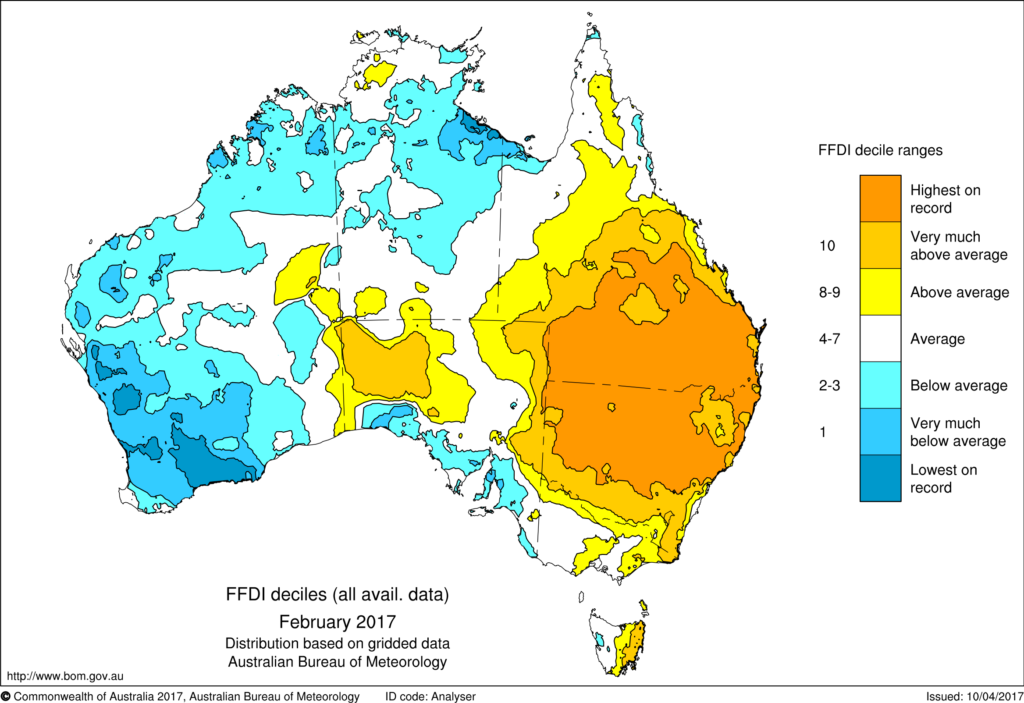
With the new dataset, we can see how rare the fire weather conditions are for a given region. For example, the Climate Information Services group of the Bureau of Meteorology are using this dataset to produce maps such as the one shown below. This map highlights the exceptional conditions experienced in February 2017 which were the highest FFDI values on record (i.e. since 1950) throughout large regions of New South Wales and southern Queensland.

This map shows that the FFDI values in February 2017 were above average for most of eastern Australia, with large regions experiencing the highest FFDI values on record.
We can also quantify extreme fire weather by determining return periods for any given region, that is, we can examine if this is a 1-in-5 or 1-in-20-year event, and map regional differences in FFDI. For example, some regions may have an FFDI value of, say, 30 a few times a year, while in other regions this value may only occur, on average, once a decade. Understanding this spatial variability is important because it allows the severity of a given FFDI value to be understood for a given location.
The dataset clearly shows that fire weather conditions we have experienced in recent years (including Victoria’s Black Saturday bushfires in 2009 and the February 2017 conditions in New South Wales and Queensland) are different to conditions that fire managers would have faced previously. Consequently, procedures for managing bushfires will need to be modified based on the global warming that has occurred to date and will continue to occur this century.
Understanding our changing climate
As well as supporting the operational work of fire and emergency management agencies, the new fire weather climatology will inform our understanding of the climate changes that are already occurring, and those still to come.
With nearly 70 years of fire data now available, we can use the dataset to identify and analyse long-term fire weather trends and relationships. We can also study the influence of the El Nińo–Southern Oscillation and other climate drivers on fire weather in Australia.
The climatology can also be used for helping upgrade models used for seasonal and climate projections. A better understanding of historical fire weather conditions means we can improve the representation of fire weather conditions in these models.
Main image credit: Flickr/Bert Knottenbled, CC BY-SA 2.0

