
1 June 2021
Michael Grose (CSIRO)
We sat down with climate projections scientist Dr Michael Grose to hear what the Hub’s been up to since the latest CMIP6 models were released in late 2019.
Michael contributes towards ESCC Hub Project 5.3: Regional climate change projections science and delivery
For a newcomer to the climate modelling world, what is CMIP all about?
CMIP – the Coupled Model Intercomparison Project – is the bread and butter to the international global modelling community. For many years, climate models were run in an ad hoc way, but the research community got organised under the CMIP global program. It is a program that coordinates a release of hundreds of new climate model simulations from the leading centres around the world every 6-7 years. The latest is CMIP phase 6 or CMIP6, which has been underway for a while but is really coming to maturity now, with currently around 50 models available for producing climate projections. Australia has submitted two world-class models to CMIP6 through the Australian Community Climate and Earth System Simulator (ACCESS) program, which is partly supported through the Hub.
In between those ‘phases’, teams around the world work on improving their individual models, taking into account the latest benchmarking, research and climate observations.
How significant is it to the international modelling community?
Global climate models are the best tools we have for understanding what drives climate changes, how and why it changed in the past and what the climate may look like in the future. Models run under different scenarios of human development help decision-makers navigate decisions around emissions mitigation and plan climate adaptation. As the database of global climate model outputs, CMIP is a massive deal.
The CMIP model outputs underpin national and international assessments of climate change, including State of the Climate and global assessment reports produced through the Intergovernmental Panel on Climate Change (IPCC). CMIP models also enable a plethora of other climate research – research into climate processes, climates of the distant past, changes to the carbon cycle, the effect of changes in land use, the effects if we ever chose to pursue ‘geoengineering’ and many more. It is also very useful to benchmark the quality of the models through comparisons with observations and with previous climate models (CMIP5), for example.
Tell us about the ‘intercomparison’ component of CMIP – why do we need to enable intercomparisons of models?
Basically, climate models can simulate the key processes and feedbacks in the climate system and can be used to understand the complex responses of the climate system to different scenarios of human influence. Their output can help guide decision-making around, for example, which emissions targets to implement, and on what timescales, and what scope of climate impacts we should prepare for under different scenarios.
All models that perform ‘acceptably well’ are useful, but different models have varying responses to the question ‘how likely is the climate to respond to a reduction in greenhouse gases?’. It is important to run model simulations under standardised conditions, so their results can be surveyed and compared to estimate a range of plausible possibilities.
Tell us about an important difference between what models project for the future?
A very fundamental feature of our climate is still not precisely known – how much global warming we will experience if we increase the greenhouse gas concentrations in the air, known as ‘climate sensitivity’. There is still a range of possibilities, and models also give different values of this important variable. Until we can estimate climate sensitivity more precisely, it is important to compare and use a range of different models that give plausible results. It is also important to evaluate how the values of climate sensitivity have changed in between model releases and understand the causes.
Hub researchers did some work with evaluating the latest models released under CMIP6. What did they find?
Our researchers were also among the first in the world to evaluate and examine the projections of CMIP6 models for our region.
Our analysis of the latest CMIP6 model simulations from a subset of more than 30 different international modelling centres showed incremental improvements of the model simulations with observations of the current climate, when compared to the previous CMIP5 models. We also found that while many aspects of the projected future climate are consistent with our long-standing evidence base, there are new and important insights on the future climate from these models.
An important feature of CMIP6 is that it has a wider and more uneven range of climate sensitivity values. CMIP6 contains a large group of models with high values of climate sensitivity, with some of the models in the range considered unlikely (but not impossible). These CMIP6 models project substantially hotter temperature projections by the end of the century compared to previous models, with some showing warming from the present of up to 7° C for Australia by 2100 if emissions were to rise at a very high rate. These projections can be considered as a ‘low likelihood high impact’ outcome when we consider climate change using a risk management lens. There are also a few models with very low, and very unlikely, values of climate sensitivity, which represent the opposite case – a ‘low likelihood low impact’ outcome.
What are the implications of high climate sensitivity?
If climate sensitivity is in fact high, and this group of models have it right, then the ‘budget’ of greenhouse gas emissions that would guarantee a particular level of global warming is lower than we generally plan for. This includes the budget needed to meet the global warming goals of the Paris Agreement, 2 °C and aiming for 1.5 °C – meaning the world would need to make greater and more urgent cuts to greenhouse gases, and scale up more negative emissions technologies to meet this target.
On a related note, the Hub did some work on presenting climate change projections of Australian climate change for these ‘global warming levels’, as opposed to the usual emissions pathway lens. We give background to understand what global warming levels mean, and how to interpret the results, then give some detail on what the warming levels (+1.5, 2, 3 and 4 °C) represent for Australia. For example, at a global warming level of +3 °C from the pre-industrial climate, Australia is projected to be between 2.8° and 3.7° C warmer, and significant changes to our average rainfall are very likely, including a drier southwest. These pages are now up on the Climate Change in Australia website.
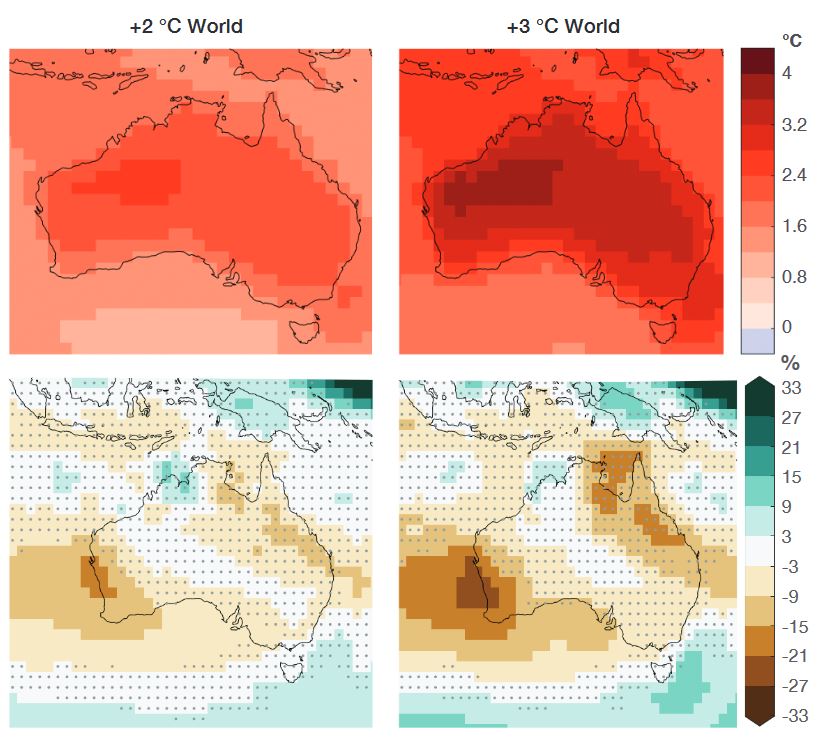
Projected change in Australian average annual temperature (top) and cool season (May-October) rainfall (bottom) at 2°C and 3°C global warming levels, based on CMIP5 models. Top: Temperature change is presented as °C change relative to 1850-1900. Bottom: Cool season rainfall change is shown as the percentage change relative to 1986-2005. Dots show where the model agreement is less than 80%. Change is quantified by ‘time sampling’ model simulations when their global temperature is near the warming level. Results are provided for a high emissions scenario (RCP8.5), but are similar under all RCPs that reach the warming levels shown. Annual and warm season rainfall maps can be accessed via the Climate Change in Australia website.
What are some of the limitations of climate models?
As I mentioned, global climate models, like those produced for CMIP6, are the best tools we have for producing future climate projections. Like all models, they are not perfect, but they are useful.
Models are evaluated against observations of the real world, and where there are important differences, then we need to account for these, either by bringing in other lines of evidence or else by lowering the confidence in which we can report results.
Also, most global climate models use spatial resolutions that are too broad (or ‘coarse’) to capture small-scale climate phenomena or provide climate information at scales useful in decision-making. For example, a typical global climate model represents climate on a spatial scale of about one degree of latitude, or close to 100 km. It’s obviously really important to understand what regional climate projections look like too.
Regional climate models can simulate smaller-scale climate phenomena, such as rainfall, at a smaller spatial scale (such as 5-20km, with some models going to ‘convection permitting’ resolution of 1-4 km). These models provide higher-resolution regional climate projections that are often better suited for decision-making purposes. But these models, and how they work within the coarser models used to drive them, also need to be carefully evaluated.
A lot of our stakeholders are understandably interested in what climate projections look like for their local climate. What other work did the hub undertake in regional climate projections?
The Hub looked at how regional climate projections compare to global climate models, as in, where do they add value? We developed a new and more sophisticated set of criteria to answer that question. We decided that ‘added value’ could be defined as when and where regional models add value simultaneously in the current climate and project a different climate change signal compared to global climate models. We found that there was the combination of both of these factors, what we termed ‘realised added value’, in regional projections for Australia for areas containing geographical features like mountains, lakes and coastlines which affect climate variables like rainfall and sea breezes. This translated to added value for regions including the Alps, Tasmania and coastlines. This new metric can be used to inform stakeholders and decision makers where there are valuable insights to be gained from regional climate modelling.
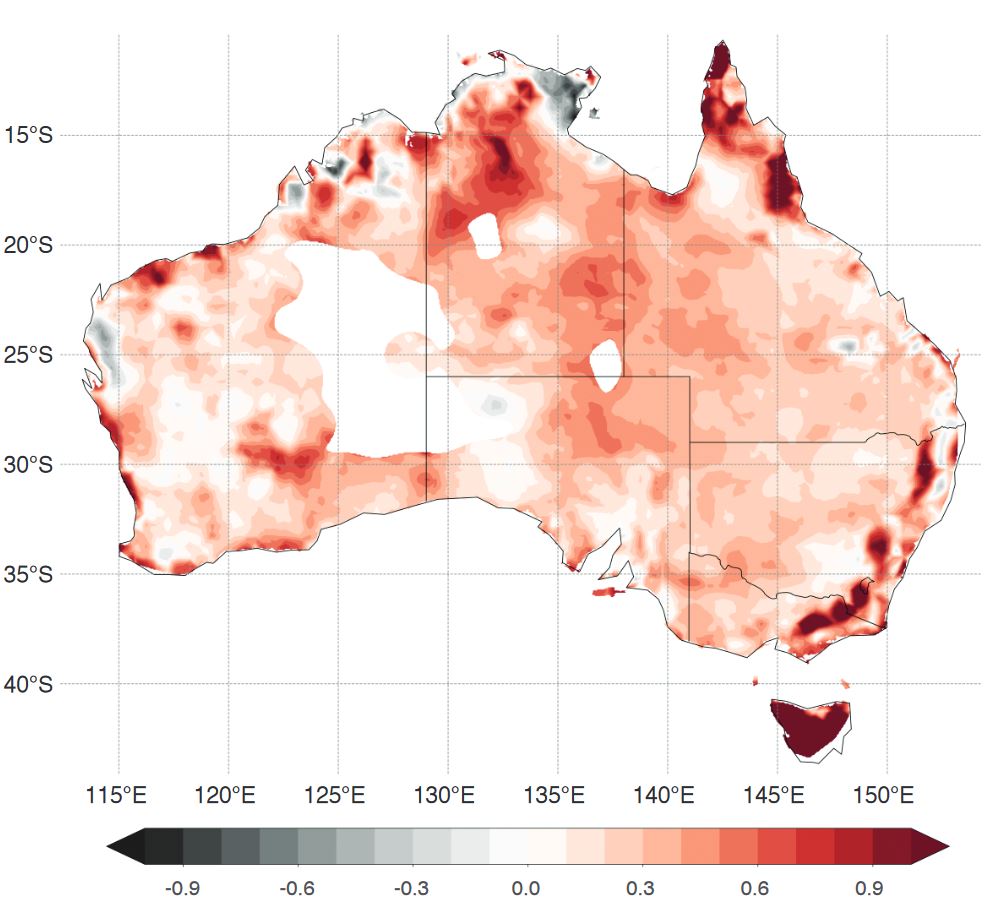
Mean ‘Realised Added Value’ for a CORDEX-Australasia subset.Red colours indicate where the downscaling is adding value to the global climate models.
What’s next in this space?
A number of Hub researchers are contributing to the upcoming Sixth Assessment Report of the Intergovernmental Panel on Climate Change (IPCC AR6), which will be released this July. All of the latest research and modelling I mentioned will be used in the next generation of regional climate projections to deliver new value to Australian stakeholders.
Access the recently published ESCC Hub fact sheets mentioned in this blog, undertaken through Project 5.3:
- Adding value to climate change projections through regional climate modelling
- New global climate models and what they say about projections of Australia’s future climate
- Reframing climate change projections for global warming levels